Testing performance
 To test the RF performance of the bias tees, it is also important to ensure that the circuit allows a pulsed bias to be correctly applied to a device under test. A good test method for this is to attempt to perform pulsed IV measurements through the bias tees as attempted previously;1 if the bias tees do not distort the IV curves, they are adequate for applying a pulsed bias to an RF measurement system. In this experiment, pulsed IV measurements with pulse lengths varying from 0.1 to 1000 ms were performed on a GaAs MESFET, using an Accent Optical Technologies Dynamic i(V) Analyzer (DiVA) model D225. The measurements were performed for three setups:
(1) no bias tees;
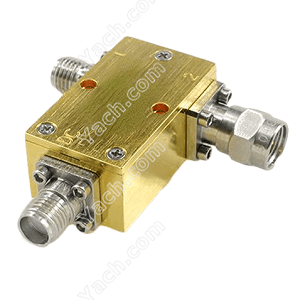
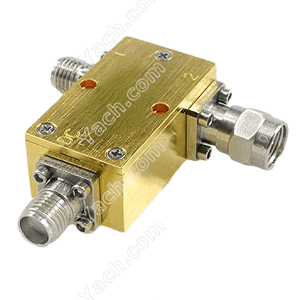
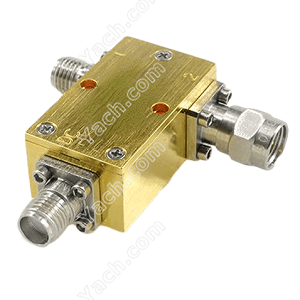
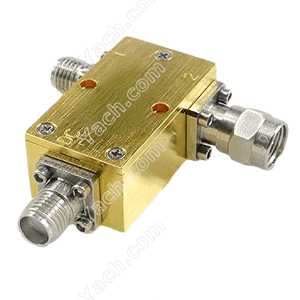
(2) a set of commercially available bias tees;
(3) a set of USF custom bias tees. In the bias tee setups, the DiVA was connected to the DC ports of the bias tees and the RF ports of the bias tees were terminated in 50 Ω loads. The measurement setup is shown in Figure 21. For the commercially available bias tees, the measurements were performed for pulse lengths varying from 1000 to 5 μs.
When attempting to measure at 2 μs, the instrument reported that it could not complete the measurement due to the large amount of gate current. Measurements were performed for the custom USF bias tees from 1000 to 0.1 μs. From simulation and initial transient measurement results, it was expected that the bias tee would function very well for pulse lengths as low as 0.1 μs. In addition, it is desired to perform pulsed IV measurements within the pulsed S-parameter system, so it is critical that the IV characteristics be accurately measurable through the bias tees. Figure 22 shows pulsed IV curves taken with different pulse lengths for the commercially available bias tees and the custom USF designed bias tees. In each plot, the dashed sets of curves are the measurements without bias tee. At 1000 μs, there is a “jog” in the knee region characteristic of the curves without bias tees.
For measurements made with the commercial bias-ts, this jog is not measured; however, the USF bias tees correctly depict this shift in the curves. The physical phenomenon behind this shift may be due to trapping effects. The commercial bias-t may lengthen the resetting time between pulses, so this effect is likely not due to the pulse length, but the pulse separation, as shown in Reference [3] for this device. If the pulse separation were lengthened, this result would likely to improve. However, even in this situation, it is interesting to note that the custom bias-ts more closely represent the measurement environment where no bias tees are used.
- 上一篇:Custom a bias tee [2022-05-04]
- 下一篇:Design Bias Tees [2022-05-04]


